Verification module
![]() |Verification MOdule
|Verification MOdule
![]() Product Overview
Product Overview![]() Contents
Contents![]() Comparison of Performance
Comparison of Performance![]() Operation Environment and Features
Operation Environment and Features![]() Case Study
Case Study
Verification Module
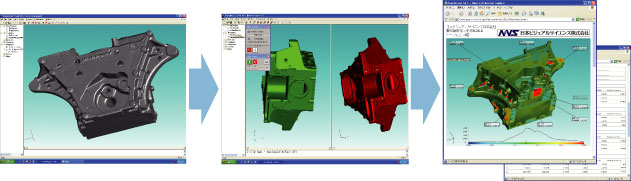
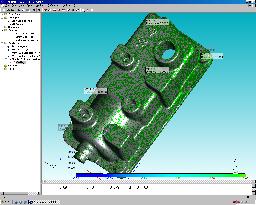
With verification module, one can compare shapes of objects, which includes comparison of a captured from a real object and models eigher captured from another real objector designed. The latter comparisonis possible because ordinary 3D CADsoftware can output STL file. Such usages are often expected in design and production.
PointMaster even can compare unhealed incomplete polygon data output from X-ray CT scanner or pointcloud output from 3D scanner with 3D CAD data.Hence, sweft, practical process is possible.
The procedure starts with loading different data such as polygon, pointcloud, and STL file from 3D CAD software one after another. Next, the positions of the 3D models are adjusted using either of the model as a benchmark. The position adjustment has two options, one of which chooses a part of the object as the criteria, and the other adjusts the position in the way the overlaping regions of the objects maximize. Finally, shapes are compared, and the error and reliability of the result are reported.
Workflow of verification
(1)Assessment of difference between CAD data and measured data
Difference between CAD data and measured data are assessed.
CAD data is imported by loading either IGES or STL files.
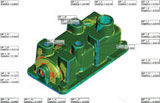
 (2)A reference point is placed on each object, and the position is roughly adjusted.
(3)The positions of measured data and CAD data are roughly&adjusted.
Procedures to adjust the positions of measured and CAD data
・Up to three points are designated to adjust the positions of objects.
・Common points are designated for each object to adjust the objects based on these points.
・A couple of windows are ised to display two models at the same time.
(4)The positions of objects roughly adjusted previously is further adjusted until two objects exactly concide.
(5)The distance between two objects are measured and displayed.
・Comparison of 3D models
・Comparison of whole or part of objects
・Point of adjustment and display format could be changed
・Displaying error with a colour
・frequency of error displayed in statistics or a graph
(6)Further enhancing the accuracy of positioning
Now moving on the the final adjustment of positions
・Best Fit Adjustment that maximizes the overlap
・Error displayed
・Position adjustment by placing points of reference
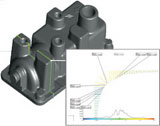
(7)Assessment of locations of errors on the suporimposed object using colours
Colours indicate the locations of errors in the fit
(8)Capable of assessment of error in the fit
Section of interest can be selected for assessment
(9)Output of errors in the conincidence of the shapes
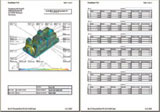
Clear reports are exported as HTML or Excel files that contain values representing errors in the fit.
・Display of the result of measurement by a table
・Coordinate, errors, and locations of errors
・Facilitating processes using no paper
![]() List of Pointmaster related products
List of Pointmaster related products