Functions
![]() |Functions
|Functions
![]() Priduct Overview
Priduct Overview
![]() Operation Environment and Features
Operation Environment and Features
1.Extracting Region of Interest and Contrasting Procedures
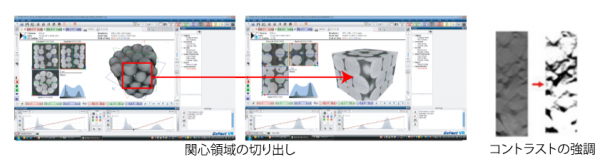
Before processing with ExFact Analysis for Porous/Particles,the greyscale images can betrimmed with ExFactVR to reduce the system load and contrasted to differentiate the materials from the void. The purpose of contrasting is to change the position of demarkation in the distribution of brightness, and therefore to make areas that seem white become white and darker areas black, resulting in the clearer display of the image. Raw data and VRF files are produced after the process.
2.Binalization

Some of the data is not clear enough due to noise as shown in the picture on the right.ExFact has kringing algorism that discerns materials and voids, and binalizes the images to remove the noise.
3.Thinning Process
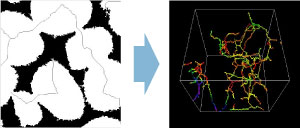
Thinning process first puts very thin line that cuts voids in a half in the perpendicular direction. Then, the parts of the lines are coloured differently in accordance with the distance between the line and the boundary of the void in the perpendicular direction. As the distance becomes shorter, the line is represented in a reddish colour, whereas bluish colours thicker ones.
4.Preparing for Quantitative Analysis
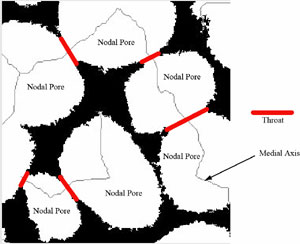
Voids are separated at throats, which are the narrowest part of the voids where line passes. The resulting void is called pore.
5.Exporting Analysis Results
![]() Distribution of the volume of nodal pore
Distribution of the volume of nodal pore
Horizontal Avis:Volume of nodal pore
Vertical Axis:Probability of having specific volume
![]() Distribution of effective radius of pores
Distribution of effective radius of pores
Horizontal radius:Effective radius
Vertical Axis:Probability of having specific effective radius
![]() Distribution of surface area of throat
Distribution of surface area of throat
Horizontal Axis:Surface area of throat
Vrtical Axis:Probability of having specific surface area
![]() Distribution of effective radius of throat
Distribution of effective radius of throat
Horizontal Axis:Effective Radius
Vertical Axis:Probability of having specific effective radius
![]() Scatter pplot reprsenting the correlation of the sizes of neighbouring pores
Scatter pplot reprsenting the correlation of the sizes of neighbouring pores
Horizontal Axis:Volumes of nodal pores
Vertical Axis:Average volume of adjacent nodal pore

![]() Distribution of effective radius of pores flanking a throat
Distribution of effective radius of pores flanking a throat
![]() Coordination numbers of nodal pores
Coordination numbers of nodal pores
 |
Horizontal Axis:Effective radius of nodal pore of interst
Verical Axis:Coordination number of nodal pore of interest
![]() Degree of narrowness of throat relative to the radius of pores.
Degree of narrowness of throat relative to the radius of pores.
 |
 |
The sizes of pores relative to throats are expressed as a ratio of their effective radius, and the distribution is described in a bar graph.
r = Effective radius of throat
R= Effective radius of pore
r / R = degree of narrowness of throat relative to the radius of pores