Features and Functions
![]() |Features and Functions
|Features and Functions
![]() Product Overview
Product Overview![]() Features and Functions
Features and Functions![]() Operation Environment
Operation Environment
Procedures
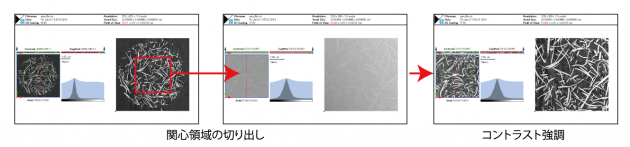
1.Extracting Region of Interest and Contrasting
Before processing with ExFact Analysis for Fiber,the greyscale images can be trimmed with ExFact VR to reduce the system load and contrasted to differentiate the fibers of interest from the background. The purpose of contrasting is to change the position of demarkation in the distribution of brightness, and therefore to make areas that;seem white become white and darker areas black, resulting in the clearer display of the image.
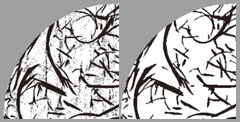
2. Binalization
Some of the data is not clear enough due to noise as shown in the picture on the right.em>ExFacthas kringing algorism that recognizes materials and the background, and binalizes the images to remove the noise.
 |
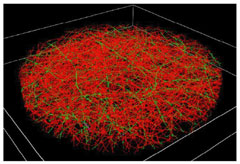
3.Thinning Process
Thinning process converts fibers into very thin lines that locate at the centres of the fibers.
The thin lines are expressed using different colours according to the length of the radius of the fibers. Fibers of smaller radius tend to be expressed in reddish colours, whereas those with larger radius blue.
4.Preparing for Quantitative Analysis
Fibers are divided where they intersect.
Moieties that are indicated "Cluster" in the picture on the right are called "bonds"
Fibers that are separated by bonds are classified accoding to the shape, and values such as length and orientation are calculated.
5.Exporting Analysis Data
There are much information that a graph provides. Examples are following.
![]() Distribution of the numbers of bonds per fiber
Distribution of the numbers of bonds per fiber
Bonds mean points of intersections of fibers
Horizontal Axis:The number of bonds per fiber
Vertical Axis:The frequency that the number appears
Crossing Angle Distribution of Crossing Angles![]()
crossing angle means the lowest angle that an intersection of fibers in three-dinension creates. In the picture above, the angle c is the crossing angle.
Horizontal Axis:The angle
Vertical Axis:The frequency that the angle appears
![]() Lengths of FIbers Distribution of the Lengths of Fibers
Lengths of FIbers Distribution of the Lengths of Fibers
• Clusters are points where more than three fibers intersect
• LL(leaf-leaf) denotes independent fibers that does not touch any fiber
• BB(branch-branch) denotes fibers flanked by clustors on both ends
• BL(branch-leaf) denotes fibers having a cluster at only one end
• All includes all the fibers classfied above
![]() Tortuosity Rough Distribution of the Orientation of Fibers
Tortuosity Rough Distribution of the Orientation of Fibers
Tortuosity is 1 when f=s when the fiber is extended. As the fiber meanders,tortuosity becomes laeges
![]() Fiber moment of inertia Distribution of Orientation of Each Fiber
Fiber moment of inertia Distribution of Orientation of Each Fiber
Fiber moment of inertia is calculated principal axes of intertia. S,M or L is given for each principal axis of intertia, meaning that the size of the axis is the smallest, middle, or the largest respectively. If the orientation of the fibers is important, the direction of the axis of the smallest moment of inertia is the orientation. In other words, plot of S corresponds to the distribution of the fibers. The size of the principal axes of inertia are normalized to 1. The numerical values of the vectores are output to CSV.